Multi-Cloud vs Hybrid Cloud: Which Strategy Fits Your Business?
Cloud computing has now become a staple of business operations. Companies turn to cloud technologies to help them become more efficient, decrease costs, and extend business capabilities. The challenge could then lie in deciding on the best cloud strategy, in particular between multi-cloud and hybrid cloud.
Though both systems offer stretchability and scalability, they serve different business requirements. Taking a good look at how each model operates would lead to saving you from making an uninformed technology decision. Read on to learn the difference between multicloud and hybrid cloud.
What Is a Multi-Cloud Strategy?
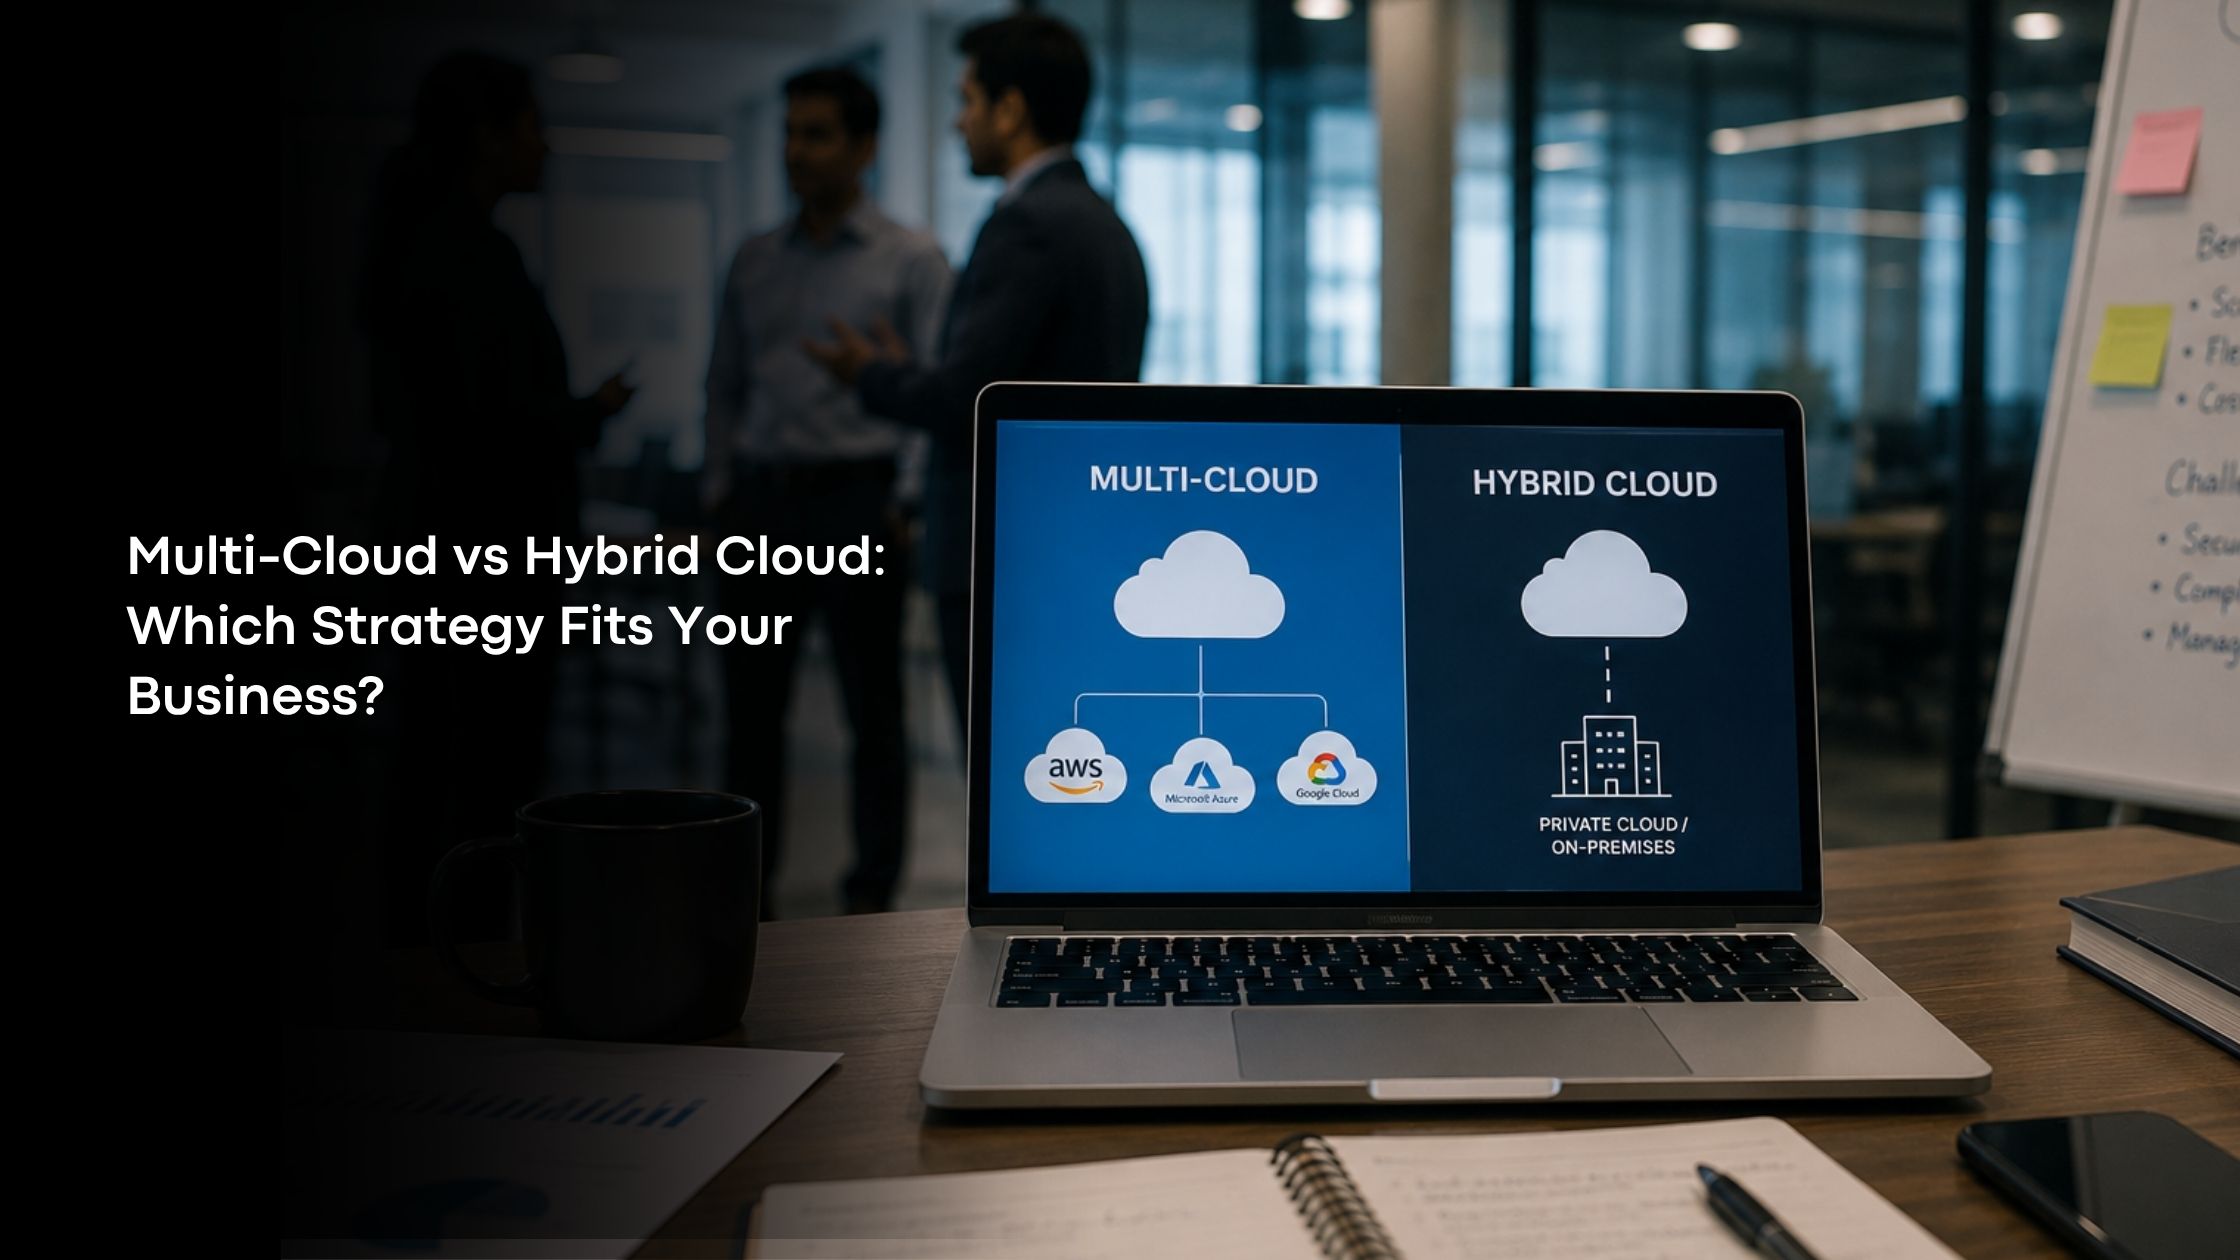
A multi-cloud strategy is the practice of using two or more public cloud providers’ services instead of a single vendor. For instance, a company may turn to a cloud provider that will serve them with application hosting, another will be offering them data analytics, and yet another will be used for backup or security services only.
Choosing the single-best platform for each workload is the thing that the approach to mix up different cloud points is based on. Having resources spread among multiple service providers, businesses that adopt multi-cloud are good for flexibility, higher service level, as well as lower risk of being stuck with only one cloud ecosystem.
What Is a Hybrid Cloud Strategy?
Hybrid Cloud is a blend of a Public Cloud and Private Cloud or On-Premises Data Centers that combine the best aspects of both deployment environments. It can be called the middle ground that lets businesses handle the most security-sensitive workloads in the Private Cloud environment and leverage Public Cloud for the applications that require elasticity and ubiquity.
The truth is that most organizations, as they cannot migrate all the systems to the Cloud at once, take Hybrid Cloud as their resort because Modernization can only be followed by their set of existing IT resources. Hybrid cloud is the very option that fulfills both the side of innovation needs and control.
Understanding the Key Difference
These terms sounding similar to one another are a normal misconception, but the fact is that multi-cloud and hybrid cloud are addressing different sets of business problems. Multi-cloud means working with several cloud providers to raise flexibility, reduce the risk of being dependent on a single vendor, which is quite similar to the traditional single cloud provider scenario.
Then again, a hybrid cloud that is concerned with the connectivity aspect of public cloud plus private infrastructure or on-premises systems. More than often, the two strategies are interwoven by the same company that operates a hybrid set-up which also involves multiple public cloud providers. Whatever the case may be, the decision whether to go for a multi-cloud, a hybrid cloud, or both would mean that other factors like your IT infrastructure, your business goals, your security needs, and your cloud strategy must be considered.
Why Businesses Choose Multi-Cloud
A good number of organizations opt for multi-cloud because of its advantages. These include having the freedom to select cloud services from multiple offerings instead of being tied to one vendor only for every workload. This model also offers the possibility of sharing business operations across providers in case of the unavailability of one. This is how making multi-cloud an enabler of business continuity is possible.
Also, the flexibility of workload distribution among providers facilitates optimization of performance, enhancement of price negotiation, and reduction of lock-in risks from a single vendor.
Why Businesses Choose Hybrid Cloud
Hybrid cloud is a great solution for companies that want to combine innovation with security and compliance. For example, businesses that deal with highly personal customer data, financial information, or healthcare records usually decide to store their most important work on private infrastructure and only use public cloud for their less sensitive applications.
Besides, hybrid cloud can be very handy for the companies having legacy systems, which haven’t been moved to the cloud yet. Such an approach not only lowers the risks involved in the migration but also enables businesses to update their IT infrastructure at a pace that suits them.
Multi-Cloud vs Hybrid Cloud: A Comparison
Feature | Multi Cloud | Hybrid Cloud |
Infrastructure | Multiple public cloud providers | Public cloud with private cloud or on-premises systems |
Primary Goal | Flexibility and vendor choice | Security, control, and gradual modernization |
Best For | Cloud-native businesses | Organizations with legacy infrastructure |
Main Benefit | Reduced vendor lock-in | Better compliance and data control |
Biggest Challenge | Managing multiple cloud platforms | Integrating cloud and on-premises systems |
Benefits and Challenges of Multi-Cloud
One of the main benefits of a multi-cloud approach is that it enables companies to tap into the best services on offer from different vendors. Besides, they also get to improve system availability and reduce reliance on just one supplier. However, the use of different cloud platforms usually leads to a rise in operational complexity.
IT departments are required to come to grips with the various billing mechanisms, security policies, monitoring tools as well as management interfaces. In fact, if there isn’t good planning, the very differences that characterize cloud platforms can be the source of complexities in cloud management. It is well worth it for organizations to develop skilled teams and acquire centralized management toolkits to be able to run a multi-cloud ecosystem successfully.
Benefits and Challenges of Hybrid Cloud
Hybrid cloud offers tremendous flexibility and at the same time one can keep a tight control on the most important business systems. It is possible for a company to safeguard its sensitive data, comply with regulatory requirements, and at the same time slowly transition to the latest technology without discarding the current setup entirely in one night.
On the contrary, bringing together private and public hybrids is a matter of proper planning. Network connectivity, security management, and data synchronization become rather challenging when the work is shifted from one environment to another. The key factors that lead to successful hybrid cloud are intensive integration, transparent governance policies, and regular performance and security monitoring.
The Bottom Line
Both multi-cloud and hybrid cloud strategies have their pros and cons. So you can align your approach with your business objectives, security needs, and expansion plans. SIRA Consulting Inc. assists businesses in evaluating, designing, and implementing cloud solutions that enhance their flexibility, performance, and operational efficiency. Get in touch with our experts for a cloud strategy that enables your sustained success.